Data Visualization Services
At futureX, we specialise in the latest workflow automation solutions fueled by artificial intelligence. Our comprehensive suite of Data and AI services includes the powerful tool of Data Visualization. With our custom Dashboard & Visualization Solutions, we empower businesses to cultivate a data-driven culture. By harnessing the potential of business intelligence, futureX enables organisations to unlock valuable insights and make informed decisions.
Our Data Visualization service offers visually compelling representations of data, transforming complex information into intuitive and actionable visualisations. Experience the power of Data Visualization with futureX and take your business to new heights.
Benefits of Data Visualization

Generate Informative Reports
We help you create insightful reports by focusing on relevant data. Our experts carefully select appropriate data visualisation types and elements after consulting with your project stakeholders and end users. Our priority is to ensure consistency and comprehensiveness in our solutions.

Enhance Forecasting with Enterprise Data
Our data visualisation solutions assist in identifying existing bottlenecks and upcoming challenges. By gaining this awareness, you can take proactive actions and be prepared.

Unlock Predictive Analysis through Visualization
As a reputable workflow automation company, we unlock the potential of your platform with custom what-if algorithms. This enables you to visualise your data and gain valuable insights into your business's future. Our predictions are backed by factual information.

Effortless Data Filtration
Our services allow you to drill down into vital information and obtain insightful results from various perspectives. For example, you can analyse your quarterly marketing ROI by channels and identify underperforming areas.

Simplify Complex Data
We offer data visualisation services that simplify the interpretation of complex data. Our informative graphs, charts, maps, and tables allow users to make sense of large datasets effortlessly.

Self-Service Reporting
We empower decision-makers by providing them with access to essential data and insights. Our goal is to make businesses more data-driven and reduce dependency on others.
What We Offer
Analysis and Reporting
We provide interactive dashboards tailored to your specific business needs, along with data visualisation tools that allow for deeper data exploration and geospatial analysis.
Self-Service Business Intelligence
Make informed decisions faster by creating quick reports and visualising data without relying on IT assistance.
Interactive BI Applications
Improve user experience by visually navigating through data, extracting valuable insights from any dataset, and taking actionable steps based on the findings.
Data Preparation
Efficiently transform, clean, and consolidate raw data into an easily analyzable format, enabling you to derive meaningful business insights.
Why Work With futureX

Insightful Reports
Avoid the frustration of scrolling through reports to compare figures or identify trends. We believe users should focus on making informed decisions rather than searching for insights. That’s why we consider data visualisation an essential part of the reporting process.

Overloaded Reports and Dashboards
Complex reports and dashboards can be overwhelming, with excessive visual elements, data types, or colours. Our meticulous design ensures immediate recognition of trends and outliers, with relevant colours and consistent chart types.
User Roles
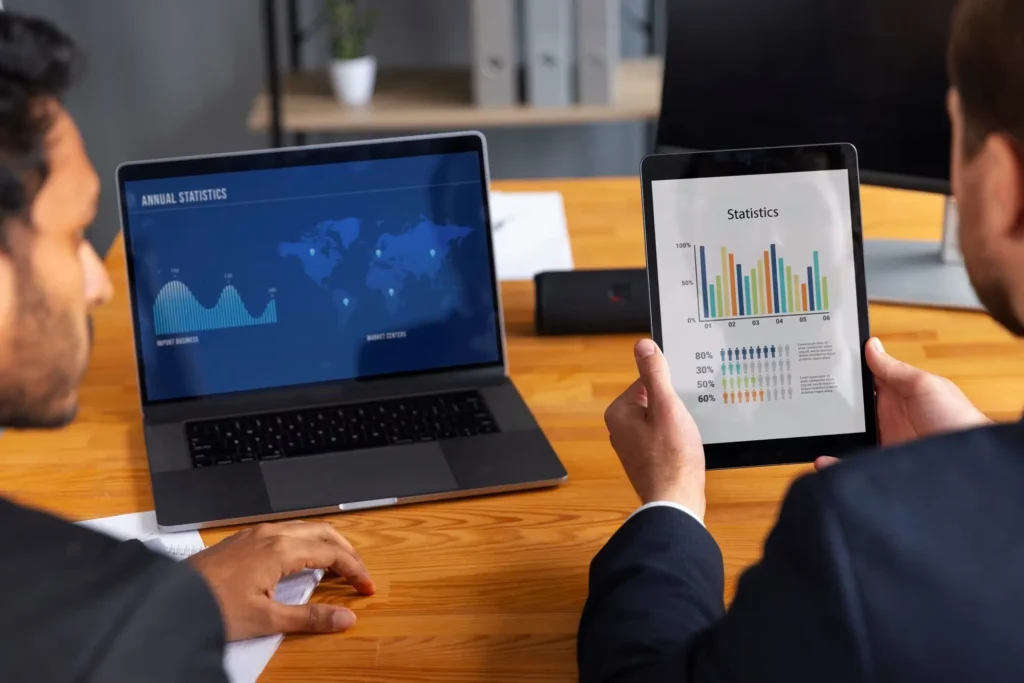
We tailor reports and dashboards to each user’s role, ensuring they can focus on relevant data. For instance, top management receives top-level reports and dashboards that provide a comprehensive overview of information.

Unanswered Questions
Our drill-down and filtering options empower decision-makers to find answers to their business questions from different angles. For example, a manager can examine overall US sales, rank them by states, and then focus on regions where sales are below the target.
Flexibility and Accessibility
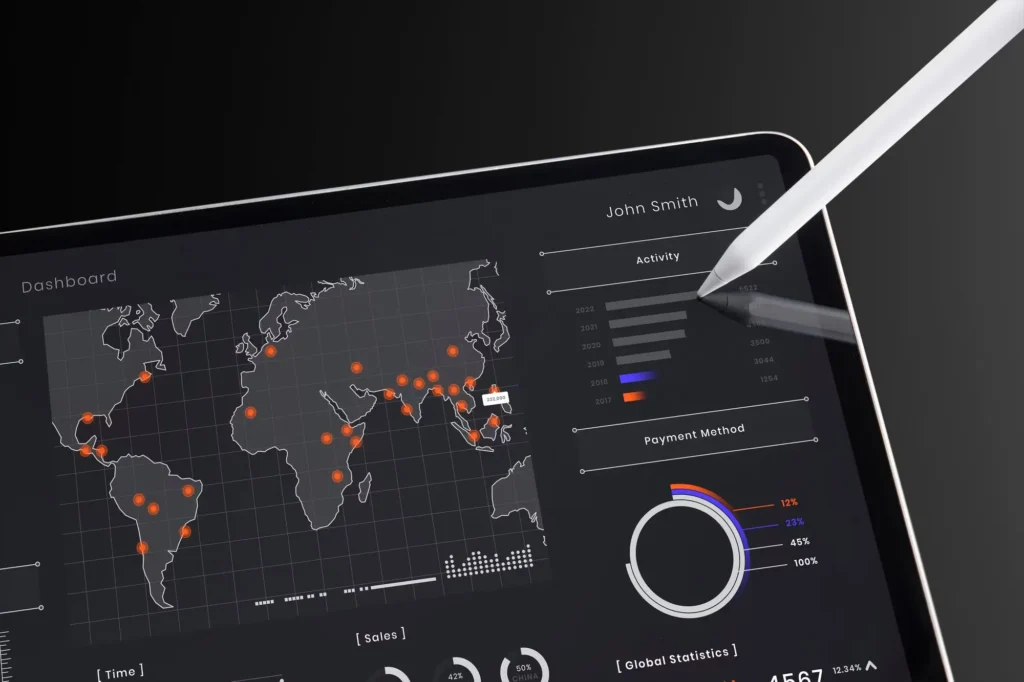
We go beyond desktop versions by designing clear-cut dashboards for mobile users. Our data visualisation services address data security challenges and incorporate special UI/UX design to ensure a seamless experience.
Frequently asked questions
Data discovery, reporting, business intelligence, data visualisation, and data aggregation are fundamental to an organisation’s ability to interpret data and make informed decisions. futureX offers business intelligence and data visualisation solutions that enable swift integration of data from diverse sources and the development of key metrics for quicker decision-making.
In today’s fast-paced digital world, making swift decisions is essential for businesses seeking a competitive edge and revenue improvement. futureX data visualisation services facilitate rapid pattern recognition and comprehension for the audience, as the human brain processes visual information more easily than written information.
futureX empowers both technical and business users to extract the desired insights from their data effortlessly, utilising a user-friendly, code-free environment. With our customised solutions and training, we have successfully assisted companies in adopting Advanced Analytics Solutions for years.
In today’s fast-paced digital world, making swift decisions is essential for businesses seeking a competitive edge and revenue improvement. futureX data visualisation services facilitate rapid pattern recognition and comprehension for the audience, as the human brain processes visual information more easily than written information.
Still have questions?
For extensive periods, futureX has been a leading provider of data visualisation services, helping companies identify trends, track the achievement of business goals, and compare performance across various categories, products, brands, and more.


